MINI LESSON
Comparing Functions
Functions can be compared using graphs, equations, and tables.
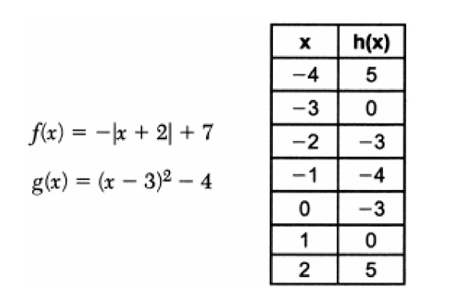
A y-intercept is the value of a function when \(x=0\).
To compare rates of change or intercepts, use the representation that is given and evaluate carefully.
Question 1
Which graph below represents a function that is always decreasing over the entire interval \(-3 < x < 3\)?
Question 2
Three functions are given below. Which functions have the same y-intercept?