MINI LESSON
Box Plots
A box plot summarizes a data set using the five-number summary.
The five-number summary consists of the minimum, Q1, median, Q3, and maximum.
The box shows the interquartile range (IQR), which is Q3 − Q1.
The median is represented by the line inside the box.
Question 1
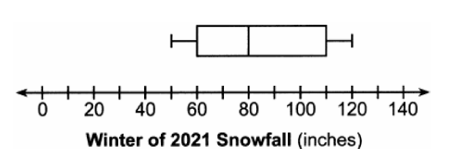
The box plot below represents the heights of students in a class. What is the median height?
Question 2
Which box plot represents the data set shown?
Question 3
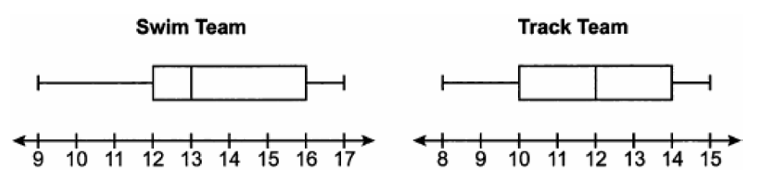
Two data sets are represented below. Which statement comparing the box plots is true?