MINI LESSON
Dot Plots
A dot plot represents numerical data using dots placed above values on a number line.
Each dot represents one data value.
Dot plots make it easy to see clusters, gaps, and outliers.
They are useful for comparing distributions and identifying the center and spread of data.
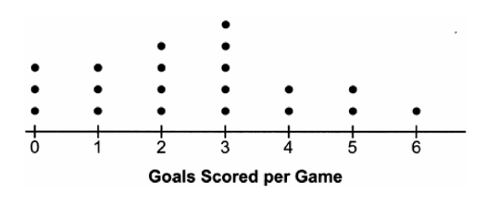
Question 1
The dot plot below represents the number of goals scored per game by a soccer team. What is the median number of goals scored?
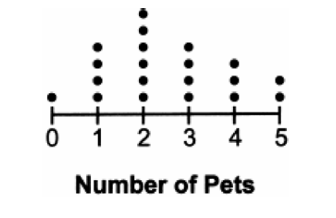
Question 2
The dot plot below represents the number of pets owned by students in a class. Which statement best describes the distribution of the data?
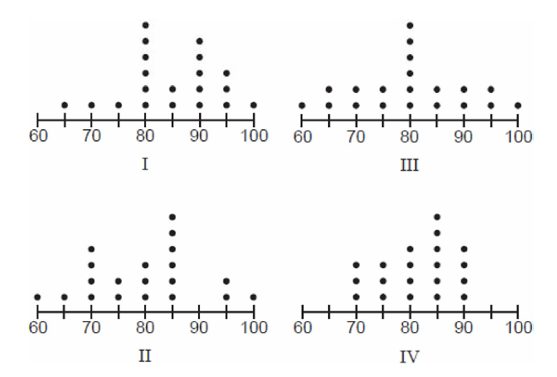
Question 3
Which representation correctly shows the data displayed in the dot plot?