MINI LESSON
Average Rate of Change
Average rate of change measures how much a quantity changes over an interval.
It can be found using the formula \(\frac{y_2-y_1}{x_2-x_1}\).
For graphs, choose two points and apply the formula.
For tables, subtract the outputs and divide by the change in inputs.
Question 1
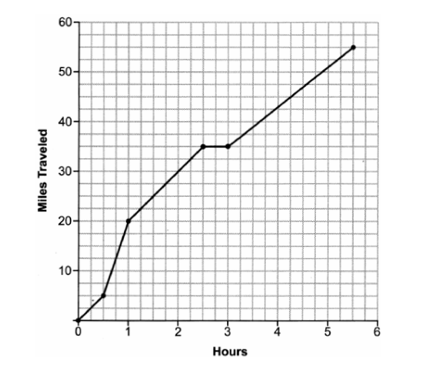
One Saturday, Dave took a long bike ride. The graph below models his trip. What was Dave's average rate of change, in miles per hour, on this trip?
Question 2
A bookstore owner recorded the number of books sold and the profit made selling the books. What is the average rate of change, in dollars per book, between 100 and 350 books sold?
| Books Sold | Profit |
|---|---|
| 100 | $50.00 |
| 250 | $275.00 |
| 300 | $350.00 |
| 350 | $425.00 |
Question 3
The function \(h(x)\) is used to calculate the average height, in inches, of a tomato plant \(x\) weeks after it is transplanted. Between weeks 4 and 12, the average rate of change, in inches per week, is
| x | h(x) |
|---|---|
| 2 | 6 |
| 4 | 12 |
| 6 | 24 |
| 9 | 51 |
| 12 | 60 |
| 16 | 64 |
Question 4
The table below shows the radioactivity level of a substance after the given time, \(t\), in seconds. What is the average rate of change in radioactivity level over the interval \(1 \leq t \leq 3\)?
| Time (seconds) | Radioactivity Level |
|---|---|
| 0 | 20 |
| 1 | 10 |
| 2 | 5 |
| 3 | 2.5 |
| 4 | 1.25 |